
Chart of the Week
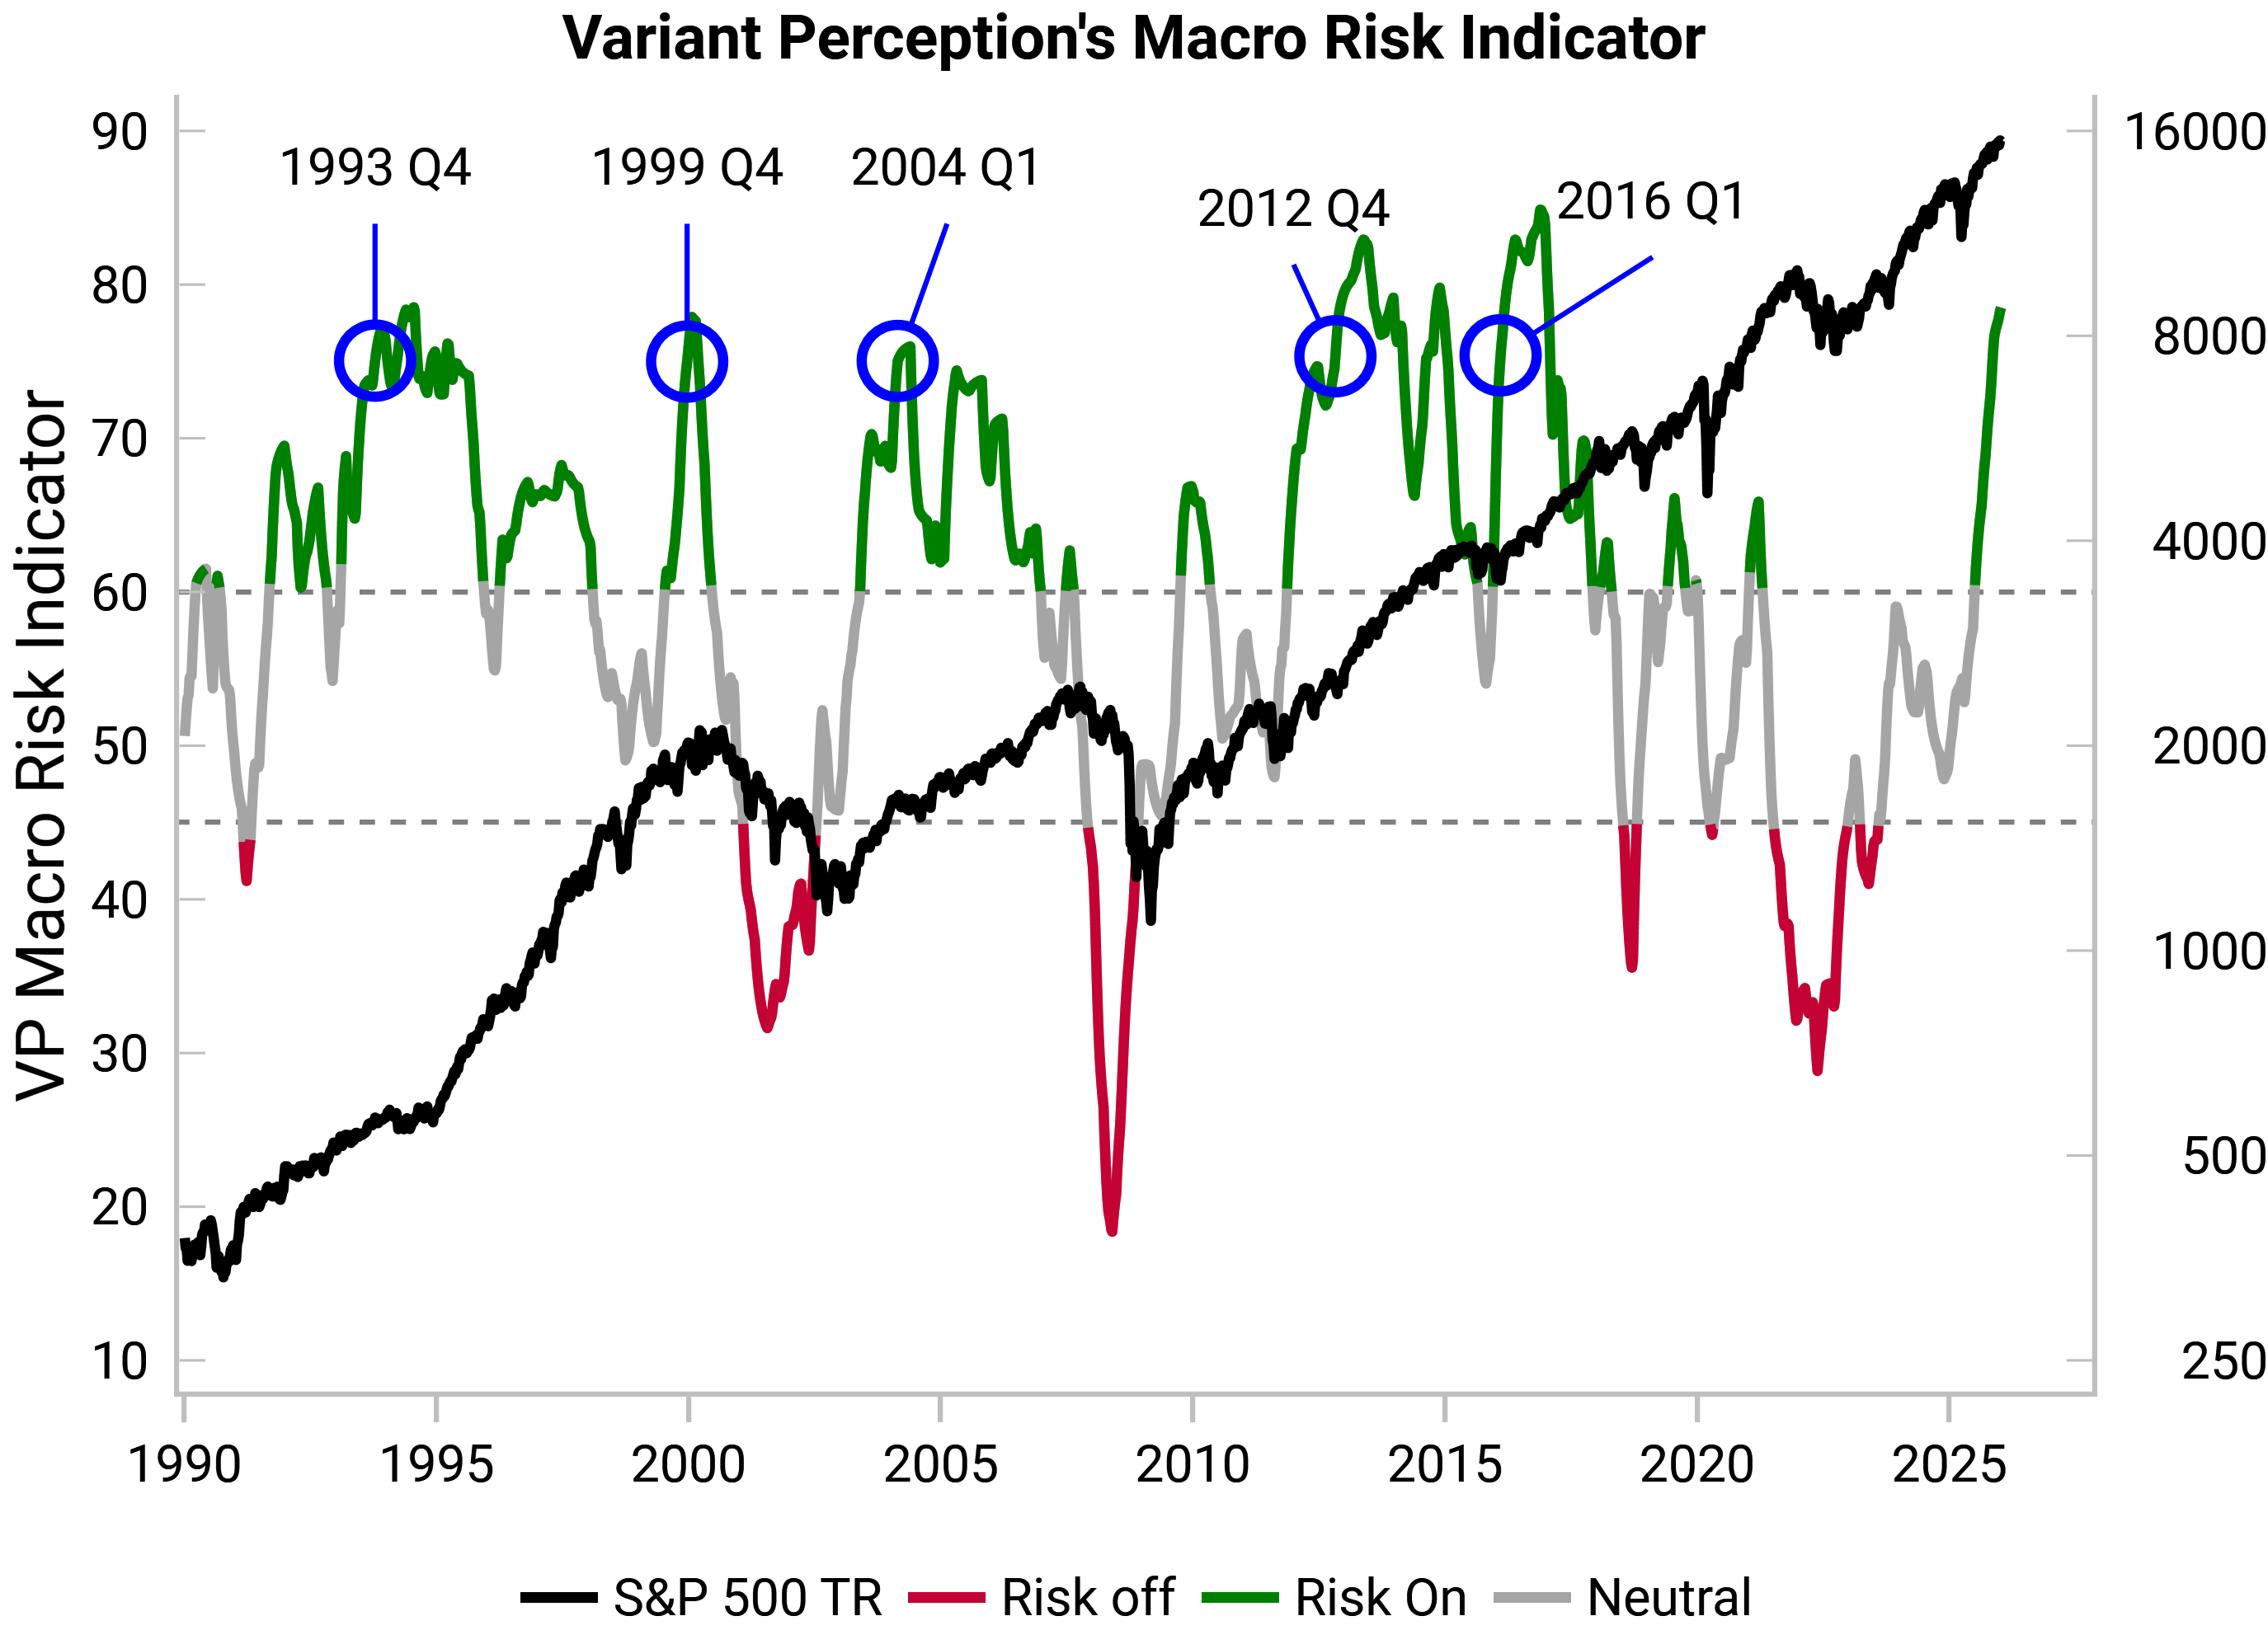
Since 1990, there have only been 5 previous instances when our Macro Risk Indicator was as bullish as today.
***
Research This Week
Echoes of 2016, 2003 and 1999: Signposts to watch - Jan. Macro Snapshot | [Watch Discussion]
- Our Macro Risk Indicator has only been as bullish as today on five occasions. None of these past moments since 1990 can be a perfect match, but three stand out: 2016, 2003 and 1999.
- Events in Venezuelan show that history is rhyming again. The United States is re-asserting strategic control over the Western Hemisphere. This was Pillar #1 in our recent thematic, The Primacy of Sovereignty.
Macro Analogs
- Cyclical Asset Allocation: Macro Risk Indicator as “risk-on” as ’16, ’03, and ’99
- 2016 Signposts: Manufacturing recovery after rolling recession
- 2003 Signposts: “Jobless” recovery with rising productivity
- 1999 Signposts: High valuations and speculative mania with generational IPO
By Asset Class
- Equity: Consensus optimism vs sound macro => energy/financial/tech barbell, EM, value
- Fixed Income: US 10y fair value range of 3.75% - 4%, watch the SOFR curve
- FX: More nuanced outlook for USD, but APAC vs EUR remains key divergence
- Commodities: Commodity outlook still strong, but parabolic metals rally due for pause
Other Insights
Practical insights on allocation, diversification, and risk tolerance—combining behavioral, liquidity, and structural perspectives.


Contact Us
Stay Connected
Our research is built for investors who need timely, repeatable insights.