
"The rear-view mirror is always clearer than the windshield." - Warren Buffett
Investing is inherently about the future, yet most financial news is obsessively focused on the recent past.
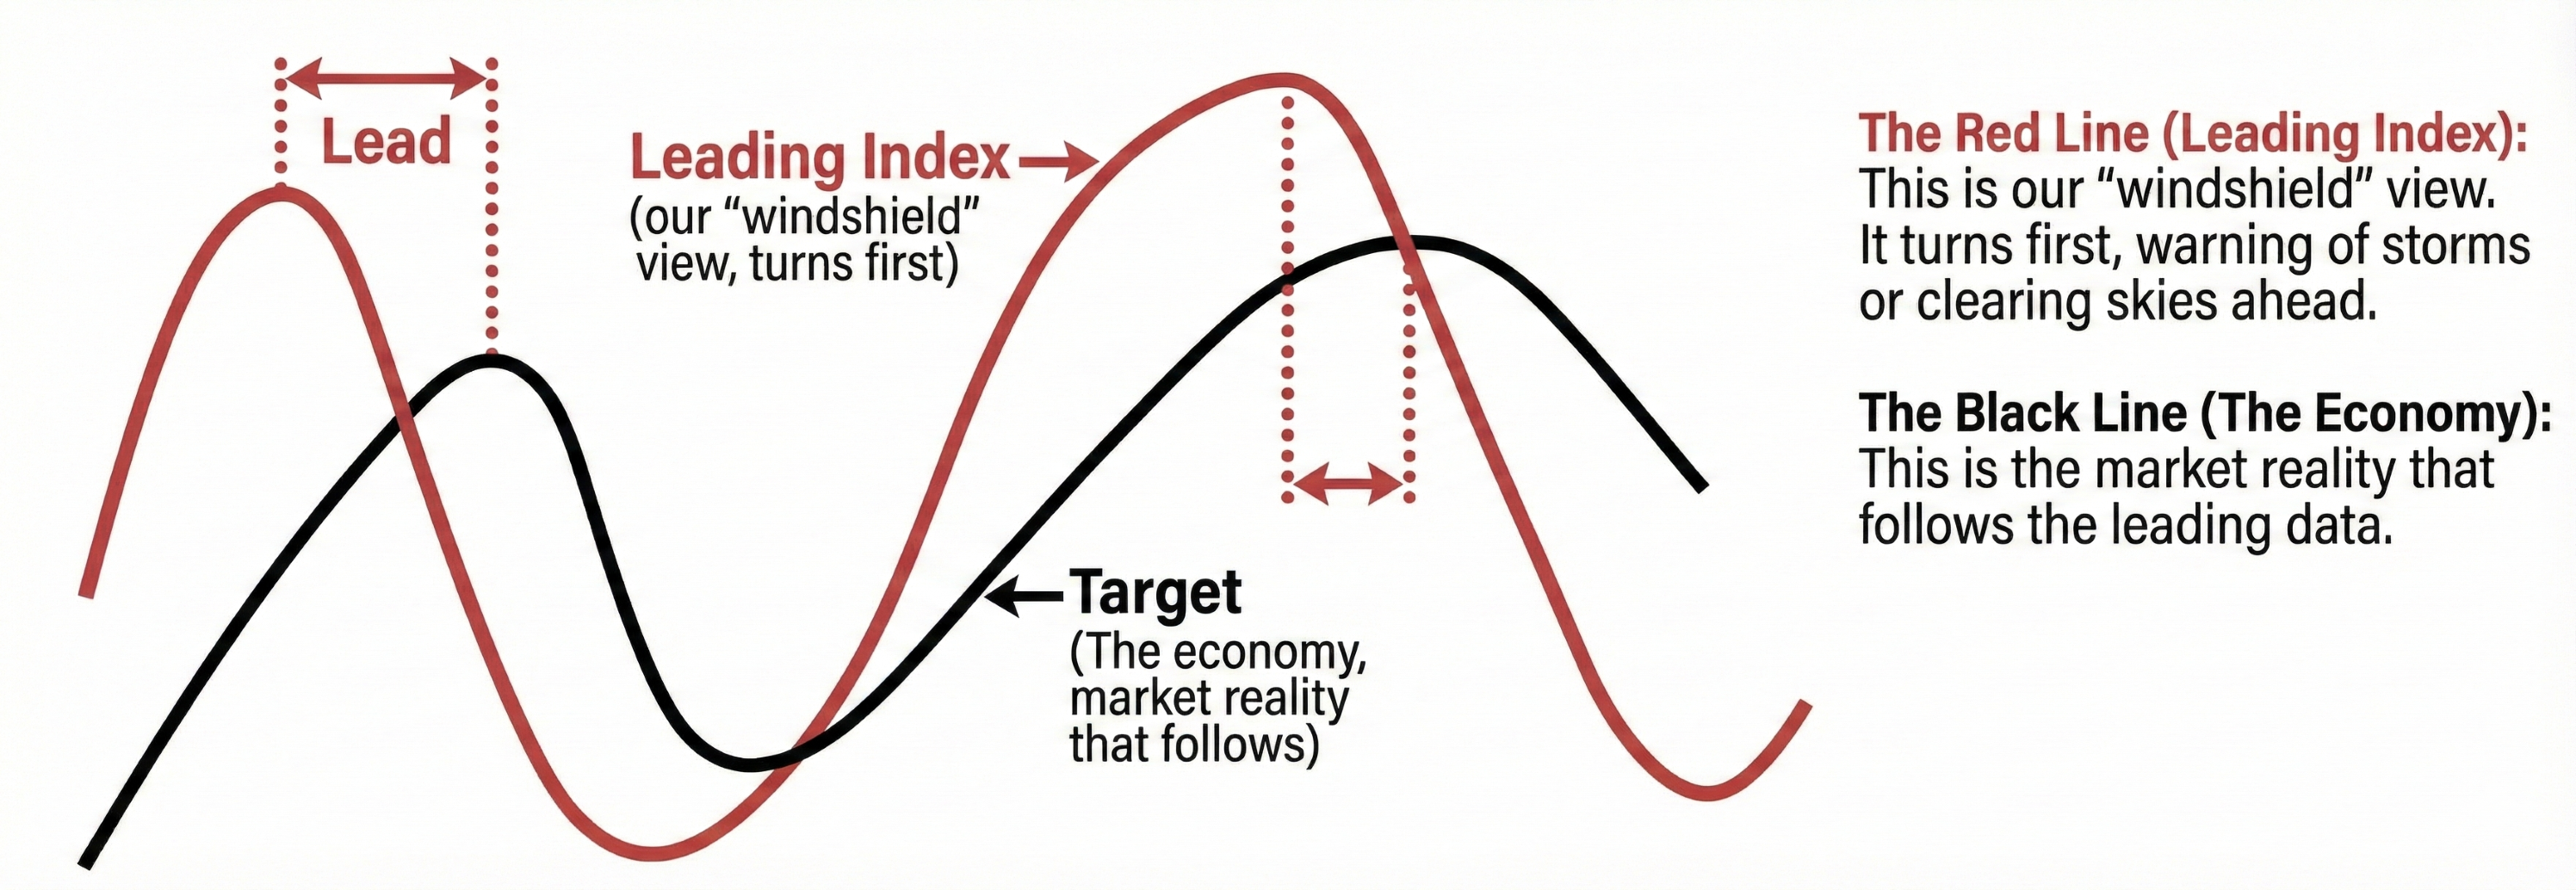
When you see headlines about high inflation or rising unemployment, you are looking at Lagging Indicators. This data tells you what has already happened. Relying on this information to manage your wealth is like driving a car while staring at the rear-view mirror: you can see exactly where you have been, but you are blind to the hazards on the road ahead.
At Variant Perception, we believe the single biggest opportunity for investors - whether you are a professional allocator or saving for retirement - is to focus on Leading Indicators and ignore the noise from lagging data.

The Sequence: How Economies Actually Move
Recessions and recoveries are not random events; they are processes that follow a sequence.
Most investors wait for "confirmation" from lagging data (like GDP or inflation reports) before acting. The problem is that by the time you see the GDP or inflation data turn, the economic effects have already happened and financial markets have likely already moved.
To protect and grow capital, we focus on Leading Economic Indicators (LEIs). These are specific data points - like building permits or money supply - that ripple through the economy before showing up in the headlines.
When markets are not positioned for a turning point foreseen by the leading indicator, that is where the opportunity exists and when the reward to risk ratio is most favorable.
The Process: Man Plus Machine
The economy is not static; it evolves. A model built for the 1970s might fail today because the drivers of growth change. For example, manufacturing wages used to drive the US housing cycle; today, credit standards are often more predictive.
Leading indicators should be used like radars. The future is inherently uncertain, so it is vital to have a framework to spot incoming changes.
We use an Adaptive Framework that combines human intuition with the discipline of machines:
- Theory (Man): We curate a universe of leading inputs that make economic and intuitive sense (e.g. credit spreads naturally lead defaults).
- Selection (Machine): We then allow our machines to identify which of those inputs are currently the most powerful predictors.
- Optimization: We then combine the selected inputs to forecast the direction of growth and inflation 6 months out.
The Data: Our "PLUS" Framework
Not all data is created equal. In a world awash with information, we need to separate the signal from the noise. We filter our data inputs using a strict set of criteria we call the PLUS framework:
- P — Prompt: Old news is no news. We prioritize data that is released quickly so our models can adapt. A detailed survey telling you what happened last quarter is rarely useful in real time.
- L — Long History: We only use data with a long history. It must be proven to work across decades and multiple business cycles, not just in the last few years.
- U — Unrevised: We avoid data that gets heavily revised later (like GDP). We prioritize using "what you see is what you get" inputs.
- S — Smoothed: Daily data can be noisy. We filter out the short-term erratic jumps to reveal the true underlying trend.
The Takeaway
Leading indicators as a concept is simple - watch the windshield, not the rear-view mirror - but executing it requires processing huge volumes of data. Our "man plus machine" approach allows us to catch cyclical shifts without chasing spurious correlations.
Don't wait for the lagging news to confirm what the market has already priced in.
Other Insights
Practical insights on allocation, diversification, and risk tolerance—combining behavioral, liquidity, and structural perspectives.
.png)
Stay Connected
Our research is built for investors who need timely, repeatable insights.