
“High returns tend to attract capital, just as low returns repel it.” - From Capital Returns: Investing Through the Capital Cycle: A Money Manager’s Reports 2002-15 By Ed Chancellor
Markets are cyclical because human behavior is cyclical.
It is a story as old as time: Greed leads to over-investment, and Fear leads to under-investment. This simple dynamic creates predictable patterns in returns across different industries and sectors that repeat across history, from the 19th-century railway mania to the dot-com bubble and the shale bust.
Most investors tend to obsess too much over demand and not enough about supply. They ask questions like, "Will consumers buy more electric vehicles next year?" or "Is the demand for copper rising?" But demand is volatile and hard to forecast with precision.
At Variant Perception, we also focus on supply. Supply changes more slowly and is easier to track, while mattering more for future returns. This is the key idea behind the Capital Cycle.
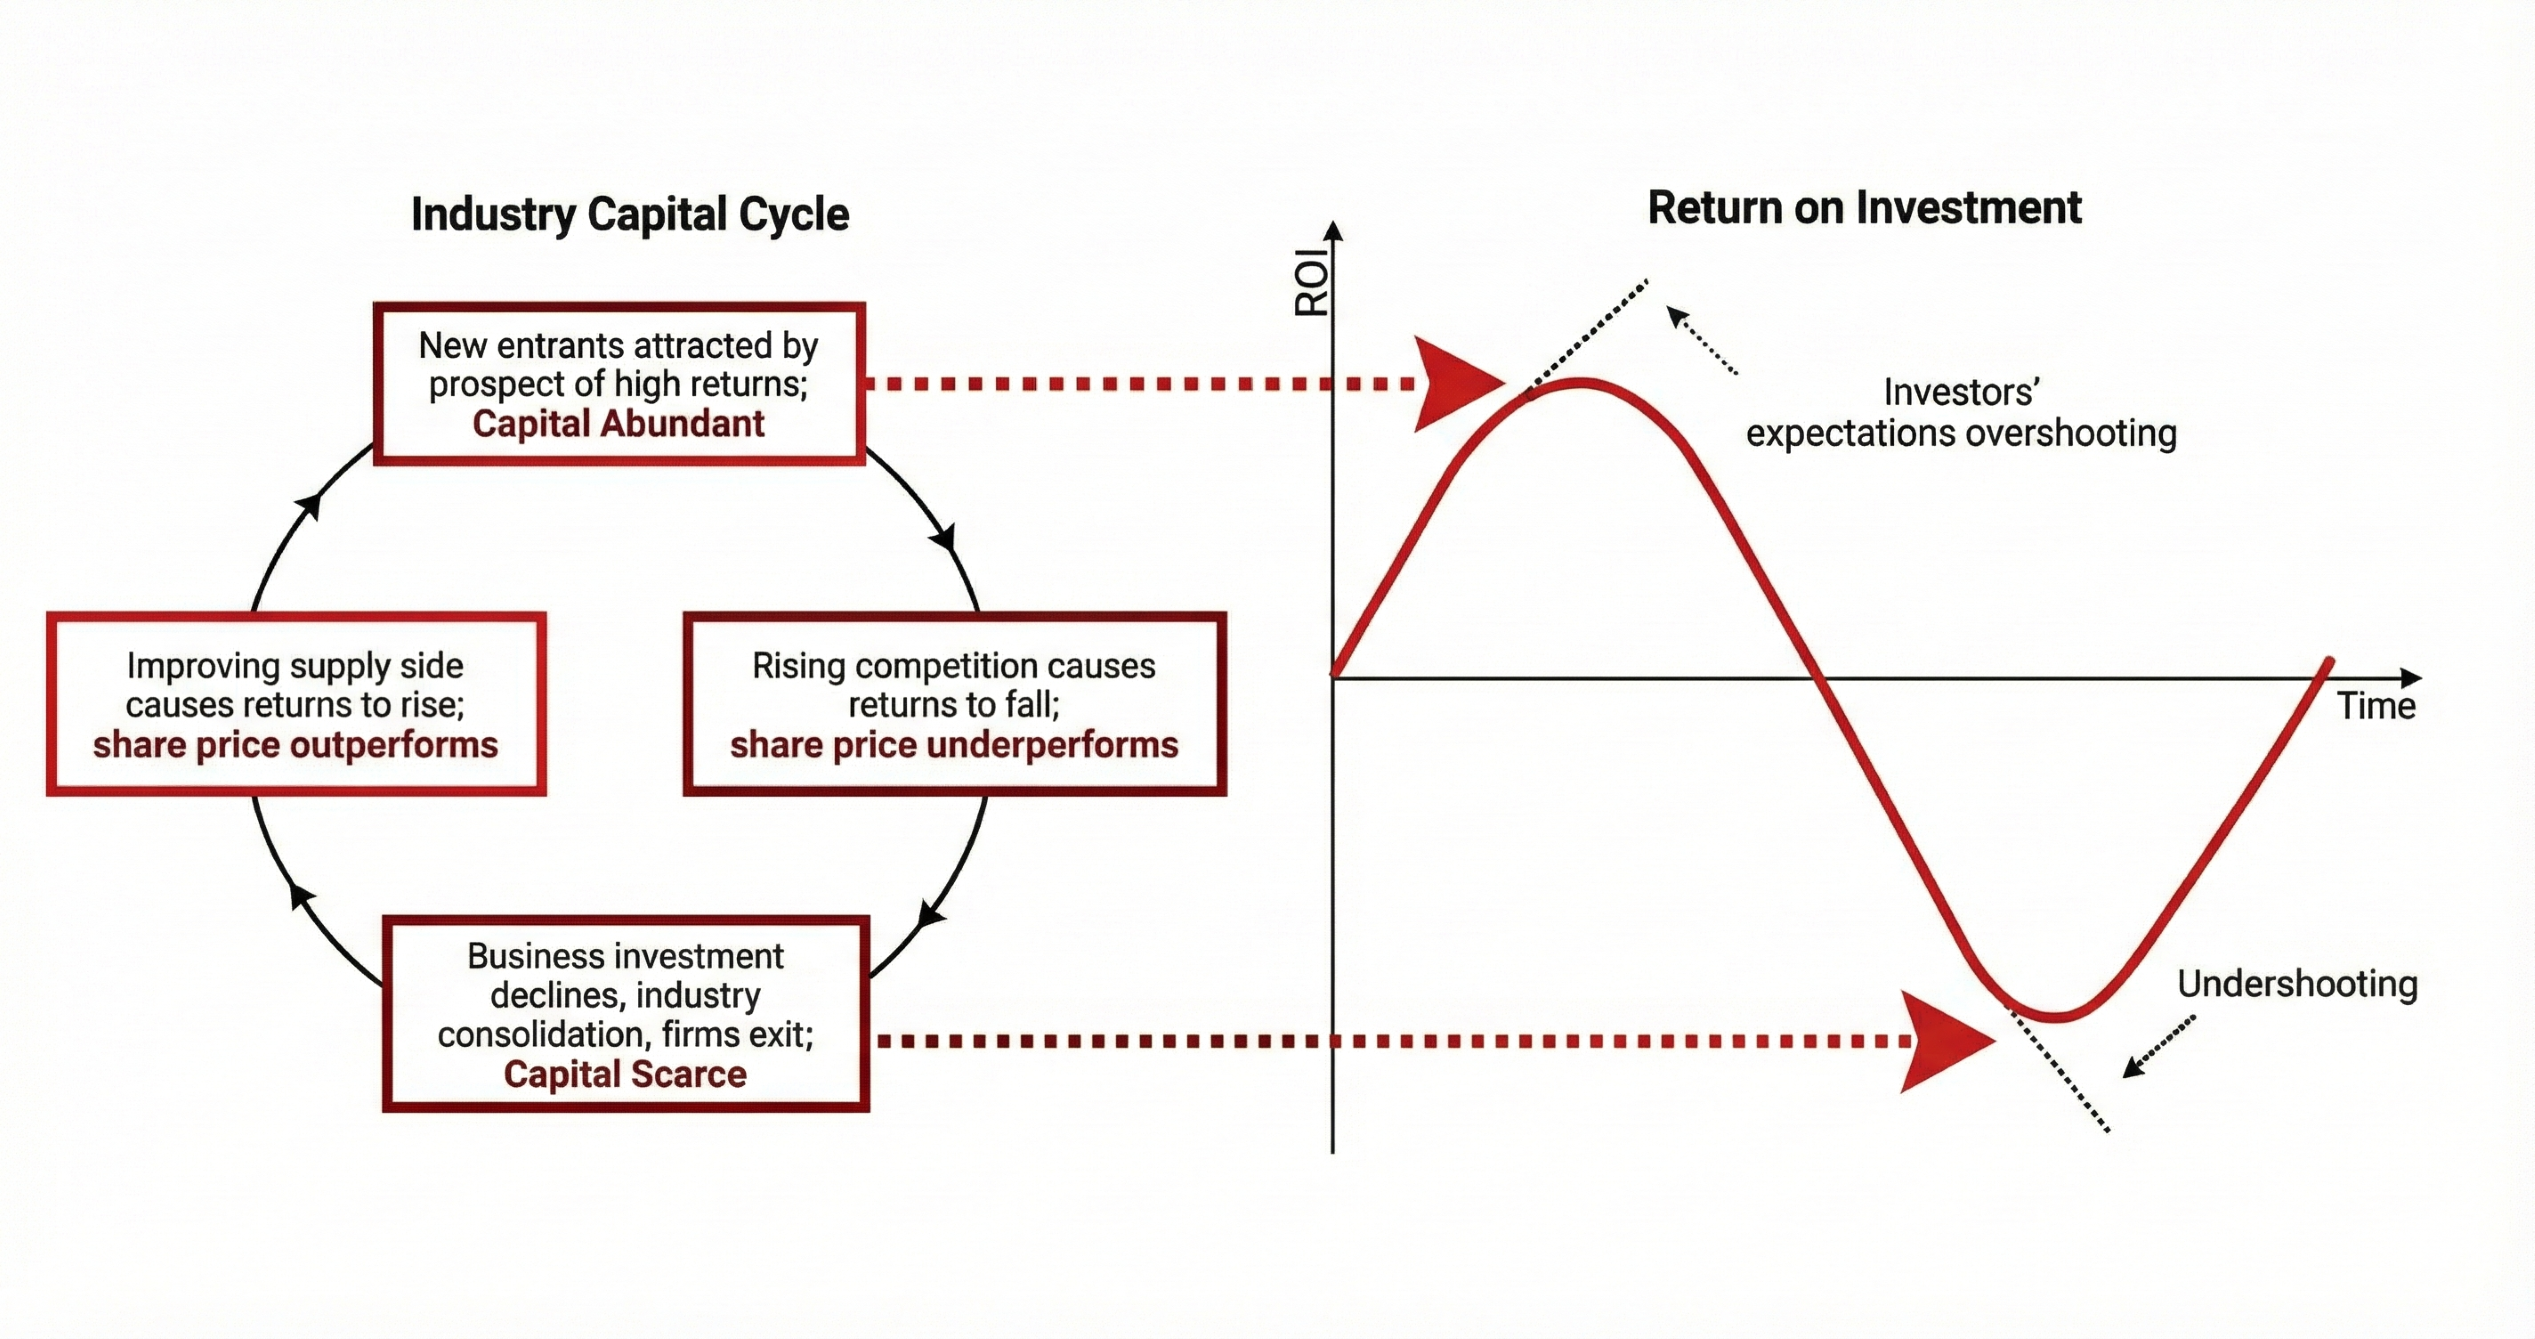
An Example: The "Burger Joint" Effect
The logic of the capital cycle is rooted in basic microeconomics, but it is easiest to understand with a simple burger story.

Imagine a small town with one highly profitable burger joint. Seeing the line out the door, three other entrepreneurs decide to open burger restaurants on the same block. Money floods in. Construction booms.
Soon, there is too much supply. To survive, the restaurants slash prices. Profits collapse for everyone. This is Capital Abundance - and it is bad for investing returns.
However the story is not over.
As profits collapse, two of the restaurants go bankrupt and close. No one wants to invest in burgers anymore. Capital leaves the sector. But the town still eats burgers.
The one surviving restaurant now has less competition and can raise prices. Profits soar. This is Capital Scarcity - and it is where the best returns are found.
But the cycle always turns. These high profits are noticed by a new generation of entrepreneurs who start building burger joints again… and so the pattern repeats.
Applying this idea more broadly, investors should classify industries into two regimes:
- Capital Abundant (The Danger Zone): Industries awash in cash, high investment, and rising competition where marginal returns are falling. We avoid these.
- Capital Scarce (The Opportunity): Industries starved of capital, with low investment, and declining competition where marginal returns are rising. We hunt for ideas here.
The Evidence: Why Scarcity Pays
Does this theory actually work in the stock market? The data says yes.
We categorized stocks globally into "Scarce" and "Abundant" buckets and the top 20% most capital-scarce stocks have outperformed the bottom 20% by 7%+ a year (gross).
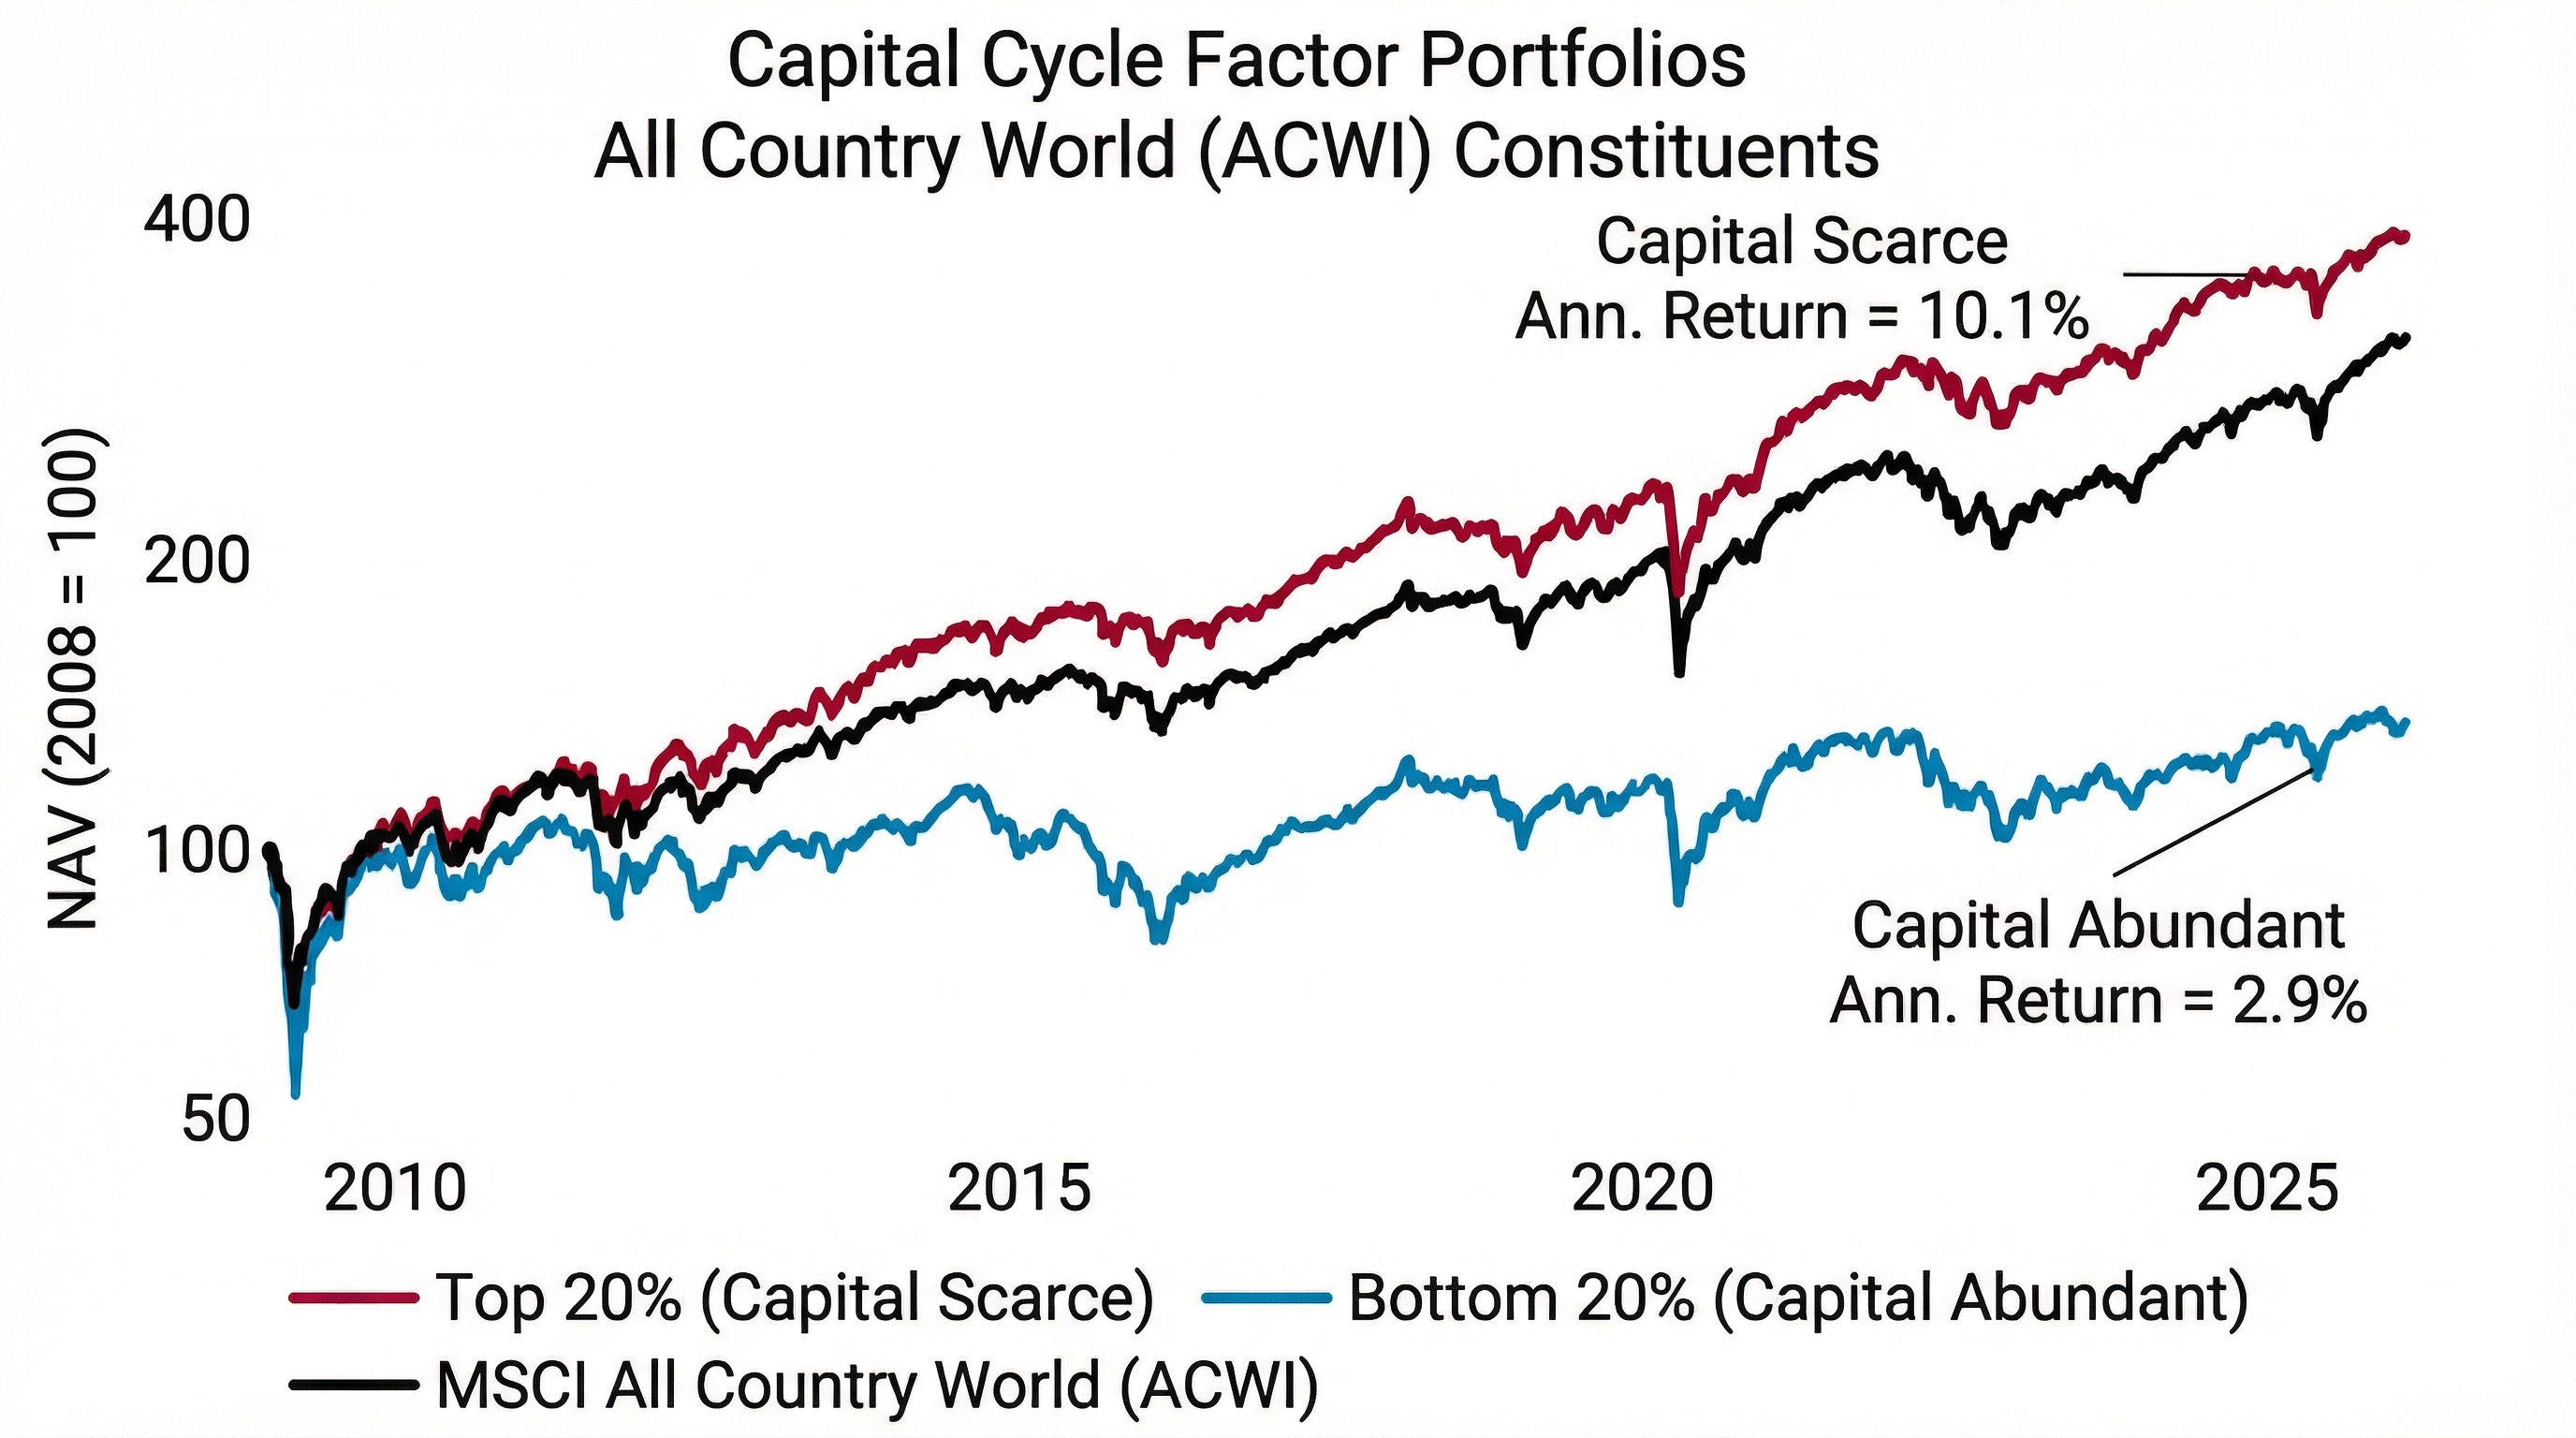
This isn't just random. This is how capitalism works. The capital cycle is a structural driver of returns, separating the long-term winners from the losers.
The Process: Finding the right data
We are not the first ones to think of the capital cycle, but we have taken a systematic approach to build on previous work:
We use an Adaptive Framework to quantify the cycle:
- The Data: We aggregate and track key accounting ratios like Capex and R&D (spending on growth), and ROIC (return on invested capital) across different industries. High spending while ROIC is falling usually signals danger (abundance). Low spending while ROIC is rising often signals opportunity (scarcity).
- The Machine: In the past, data was blunt. A conglomerate like Amazon would be lumped into one sector. Today, we use Natural Language Processing to read financial reports and split these giants into their specific business lines. This gives us a more precise view of where capital is truly flowing.
- The Context: We compare companies and industries against their peers, while also taking into account the cost of capital. This ensures we aren't unfairly penalizing sectors that naturally have different capital structures.
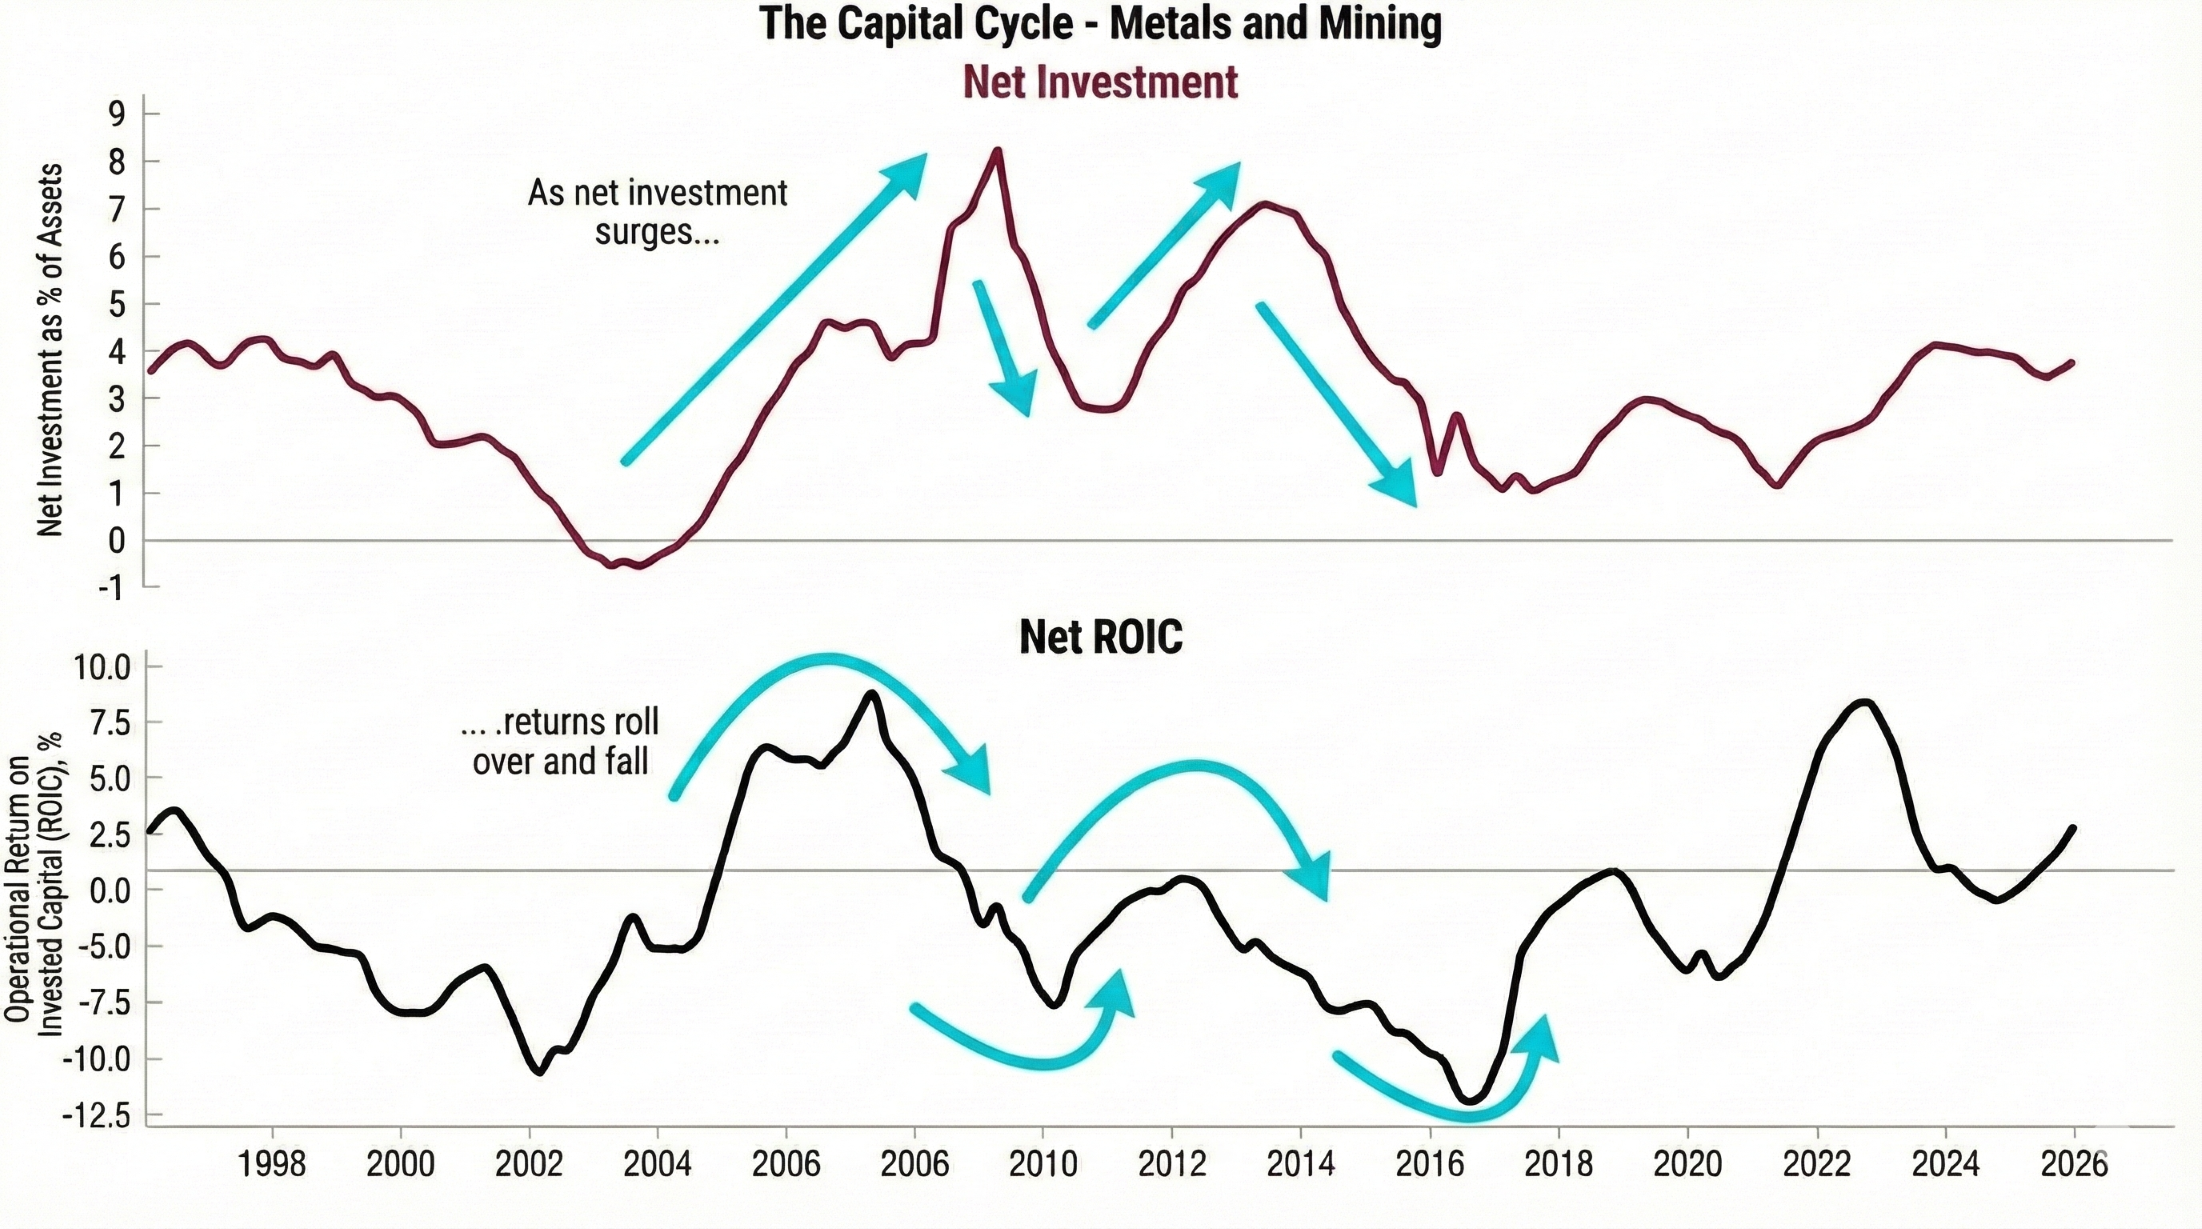
Case Study: Metals & Mining
The mining sector is a textbook example of the capital cycle in action. Historically, every time mining companies ramp up spending (the red line rising in the chart below), their future returns (the black line) fall. Conversely, when they reduce capital spending, future returns rise.
The Takeaway
Investing is about tilting the odds in your favor, swimming with the tide, not against it.
The capital cycle reveals the tide. It identifies which industries are facing strong headwinds from overcapacity and which are enjoying the tailwinds of less competition.
Other Insights
Practical insights on allocation, diversification, and risk tolerance—combining behavioral, liquidity, and structural perspectives.

Stay Connected
Our research is built for investors who need timely, repeatable insights.